7.20 Example — Tel 2M Spyder Spot Diagram
PDF section 7.20. Source script: KrakenOS/Examples/Examp_Tel_2M_Spyder_Spot_Diagram.py.
Builds the 2 m telescope model and produces a spot diagram on-axis, including the central-aperture obstruction of the primary mirror and the spider vanes — visible as the characteristic cross pattern around the core spot.
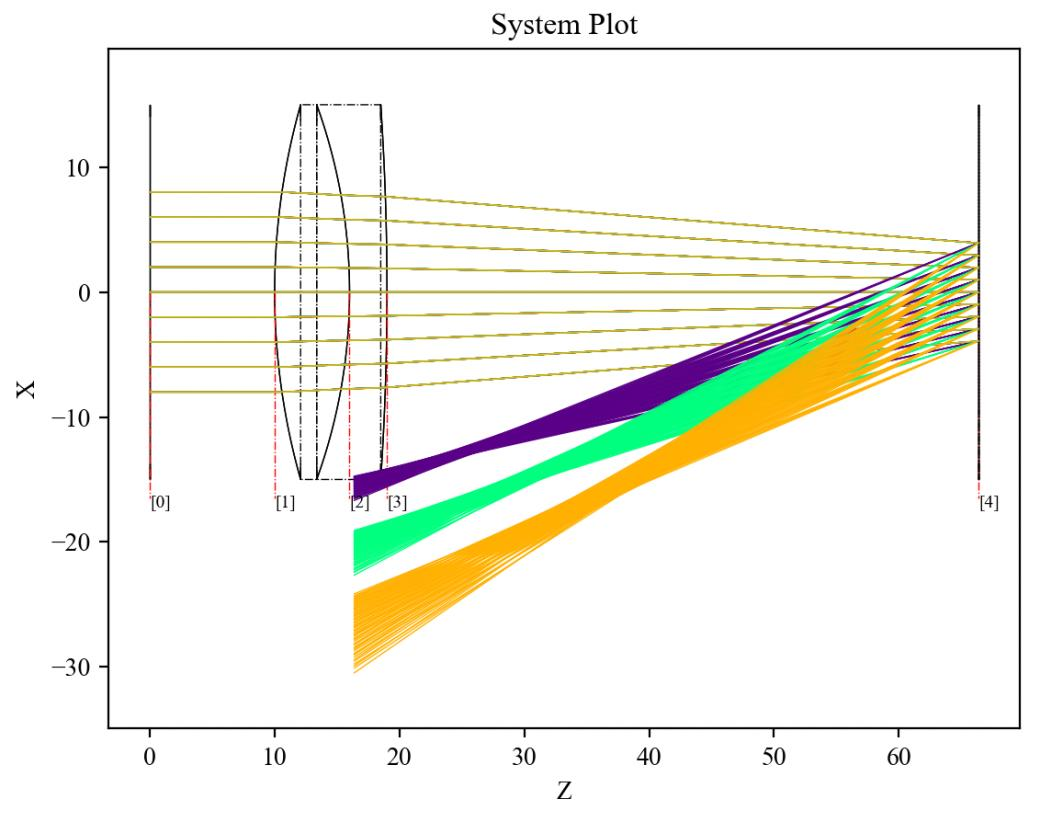
Figure 27. Spot diagram of the 2 m telescope with the secondary’s spider-vane diffraction pattern.
#!/usr/bin/env python3
# -*- coding: utf-8 -*-
"""Examp Tel 2M Spyder Spot Diagram"""

import matplotlib.pyplot as plt
import numpy as np
import pyvista as pv
from importlib import metadata
required = {'KrakenOS'}
installed = {dist.metadata["Name"] for dist in metadata.distributions() if dist.metadata.get("Name")}
missing = {pkg for pkg in required if pkg not in installed}

if missing:
    print("No instalado")
    import sys
    sys.path.append("../..")


import KrakenOS as Kos

# ______________________________________#

P_Obj = Kos.surf()
P_Obj.Rc = 0
P_Obj.Thickness = 1000
P_Obj.Glass = "AIR"
P_Obj.Diameter = 1.059E+003 * 2.0
P_Obj.Drawing = 0

# ______________________________________#

Spider = Kos.surf()
Spider.Rc = 999999999999.0
Spider.Thickness = 3.452229924716749E+003 + 100.0
Spider.Glass = "AIR"
Spider.Diameter = 1.059E+003 * 2.0
plane1 = pv.Plane(center=[0, 0, 0], direction=[0, 0, 1], i_size=30, j_size=2100, i_resolution=10, j_resolution=10)
plane2 = pv.Plane(center=[0, 0, 0], direction=[0, 0, 1], i_size=2100, j_size=30, i_resolution=10, j_resolution=10)
Baffle1 = pv.Disc(center=[0.0, 0.0, 0.0], inner=0, outer=875 / 2.0, normal=[0, 0, 1], r_res=1, c_res=100)
Baffle2 = Baffle1.merge(plane1)
Baffle3 = Baffle2.merge(plane2)
AAA = pv.MultiBlock()
AAA.append(plane1)
AAA.append(plane2)
AAA.append(Baffle1)
Spider.Mask_Shape = AAA
Spider.Mask_Type = 2
Spider.TiltZ = 0

# ______________________________________#

Thickness = 3.452229924716749E+003
M1 = Kos.surf()
M1.Rc = -9.638000000004009E+003
M1.Thickness = -Thickness
M1.k = -1.077310000000000E+000
M1.Glass = "MIRROR"
M1.Diameter = 1.059E+003 * 2.0
M1.InDiameter = 250 * 2.0

# ______________________________________#

M2 = Kos.surf()
M2.Rc = -3.93E+003
focusShift = 1.0  # Set cero to focus, 1 is only to see the spider is the spot diagram
M2.Thickness = Thickness + 1.037179115116706E+003 + focusShift
M2.k = -4.328100000000000E+000
M2.Glass = "MIRROR"
M2.Diameter = 3.365E+002 * 2.0

# ______________________________________#

P_Ima = Kos.surf()
P_Ima.Diameter = 100.0
P_Ima.Glass = "AIR"
P_Ima.Name = "Plano imagen"

# ______________________________________#

A = [P_Obj, Spider, M1, M2, P_Ima]
configuracion_1 = Kos.Setup()

# ______________________________________#

Telescopio = Kos.system(A, configuracion_1)
Rayos = Kos.raykeeper(Telescopio)

# ______________________________________#

tam = 7
rad = 2200 / 2
tsis = len(A) - 1
for i in range(-tam, tam + 1):
    for j in range(-tam, tam + 1):
        x_0 = (i / tam) * rad
        y_0 = (j / tam) * rad
        r = np.sqrt((x_0 * x_0) + (y_0 * y_0))
        if r < rad:
            tet = 0.0
            pSource_0 = [x_0, y_0, 0.0]
            dCos = [0.0, np.sin(np.deg2rad(tet)), np.cos(np.deg2rad(tet))]
            W = 0.6
            Telescopio.Trace(pSource_0, dCos, W)
            Rayos.push()

# ______________________________________#

Kos.display3d(Telescopio, Rayos, 2)
X, Y, Z, L, M, N = Rayos.pick(-1)

# ______________________________________#

plt.plot(X, Y, 'x')
plt.xlabel('x')
plt.ylabel('y')
plt.title('Spot Diagram')
plt.axis('square')
plt.show()