Case Study 10: Multi-Source Illumination
Goal
This case study demonstrates explicit multi-source authoring:
load a layout with two independent physical source records;
verify that source rows do not consume KrakenOS surface indices;
inspect both sources in Scene Source Manager;
audit per-source throughput in Source Illumination Report;
run detector and source-illumination maps at the shared detector.
The screenshots in this tutorial are generated from the live Tk UI with:
python -m KrakenOS.UI.capture_multi_source_case_study_screenshots
Load The Layout
Start the UI with
python -m KrakenOS.UI.layout_editor.Choose
Layouts -> Sources / Illumination -> Multi-Source Illumination Example.Keep
Trace mode = Non-Sequential Preview.Click
Update.
The table contains one Object row, two Illumination Source scene rows,
a shared aperture, and a shared detector. The source rows are scene entities:
they are visible in the table but do not consume KrakenOS optical-surface
indices.
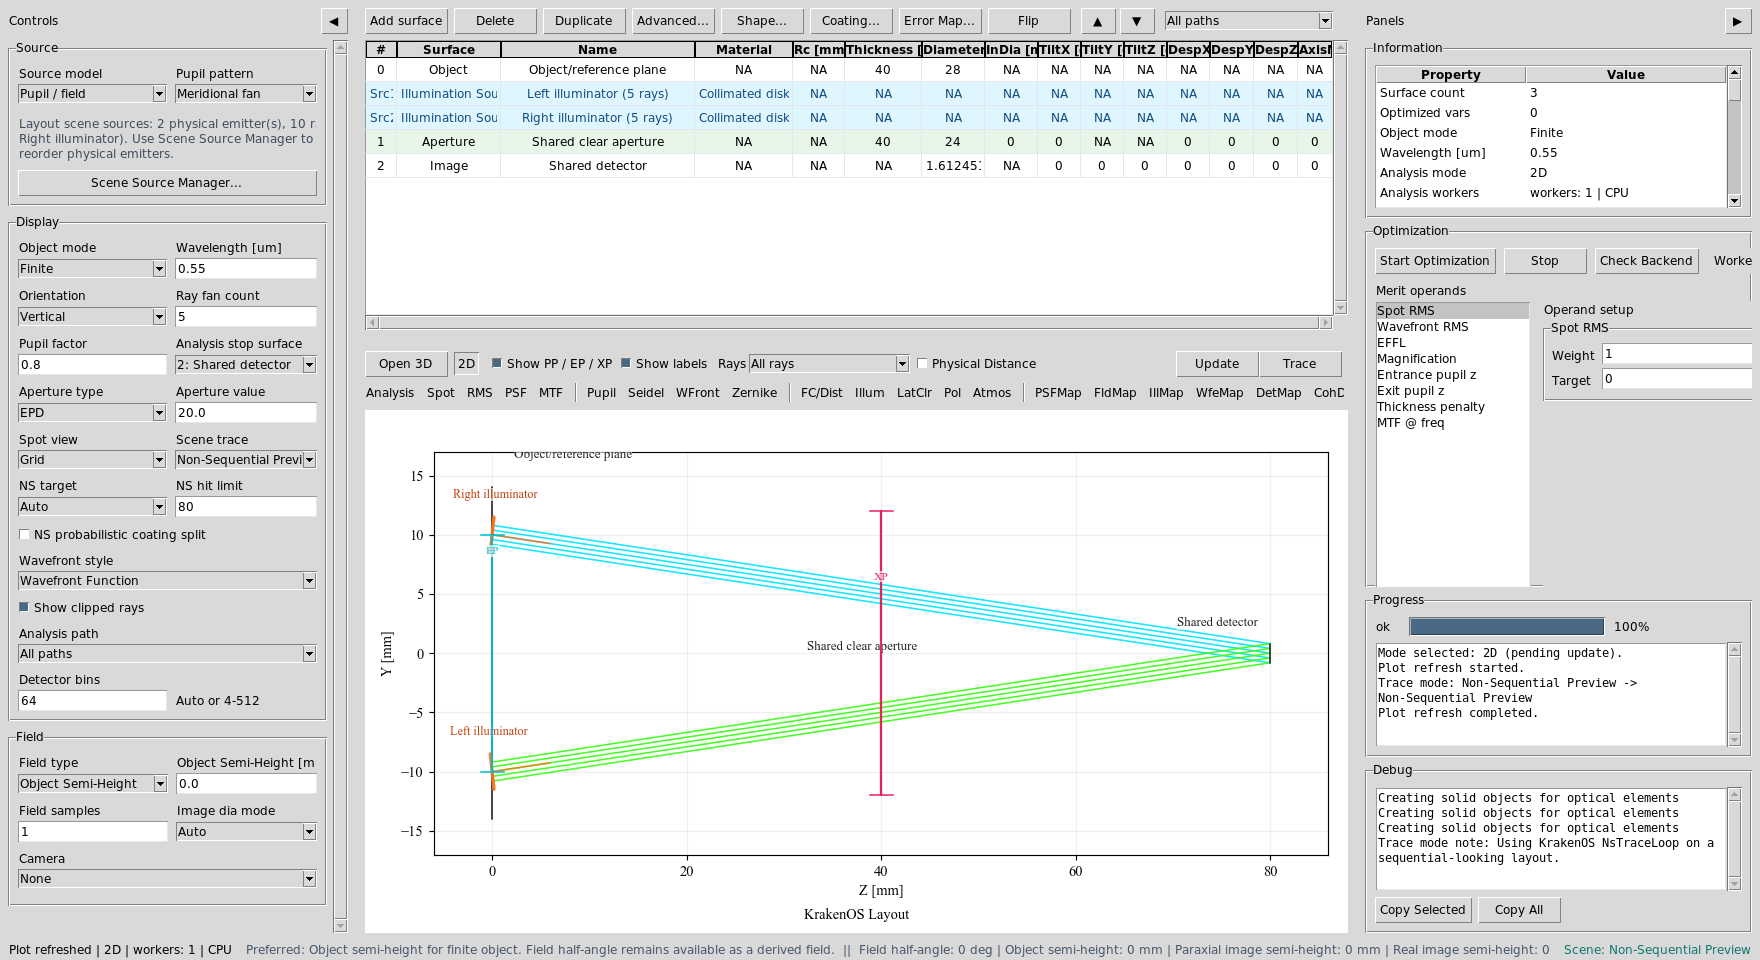
Src1 and Src2 are independent source records. The detector remains
surface S2.
Read The Layout
The left illuminator launches upward from Y=-10 mm and the right
illuminator launches downward from Y=+10 mm. Both pass through the same
clear aperture and land on the shared detector.
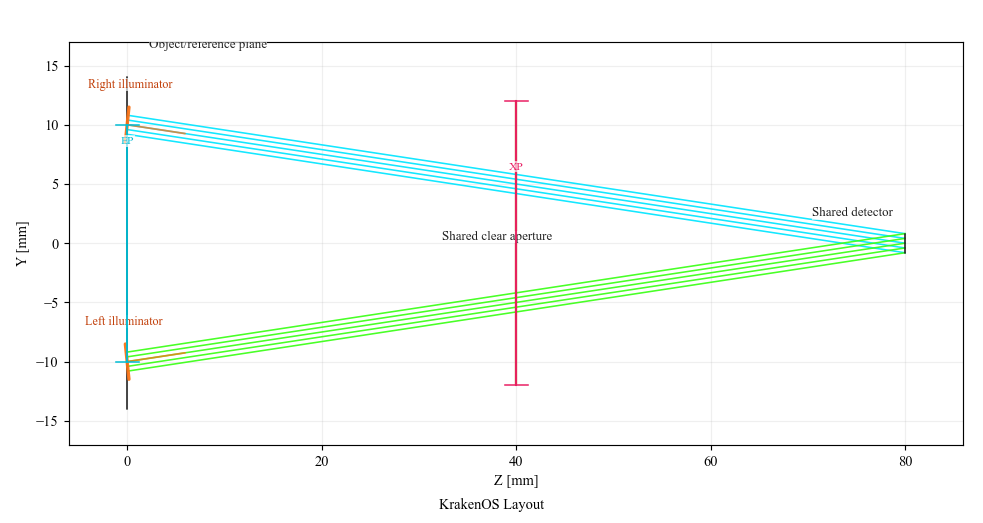
The two source bundles are separate physical emitters aimed at the same detector path.
Inspect Scene Sources
Choose Actions -> Scene Source Manager.... The manager edits the explicit
SETTINGS["scene_sources"] records.
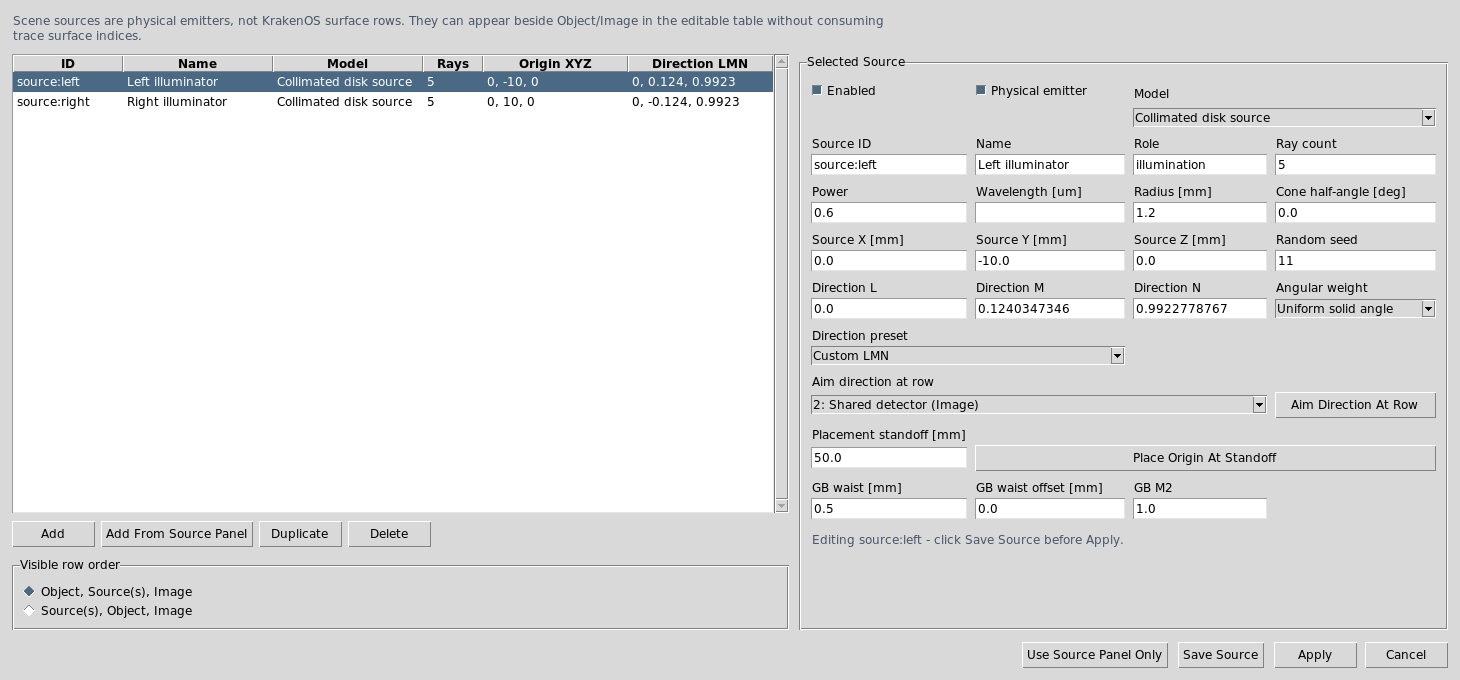
Each source has its own ID, position, direction, radius, ray count, power, seed, and source model. Editing these fields changes the physical emitter, not the Object row.
The preset source powers are:
source:left  power = 0.6
source:right power = 0.4
Audit Per-Source Throughput
Choose Actions -> Source Illumination Report and set Target to:
2: Shared detector
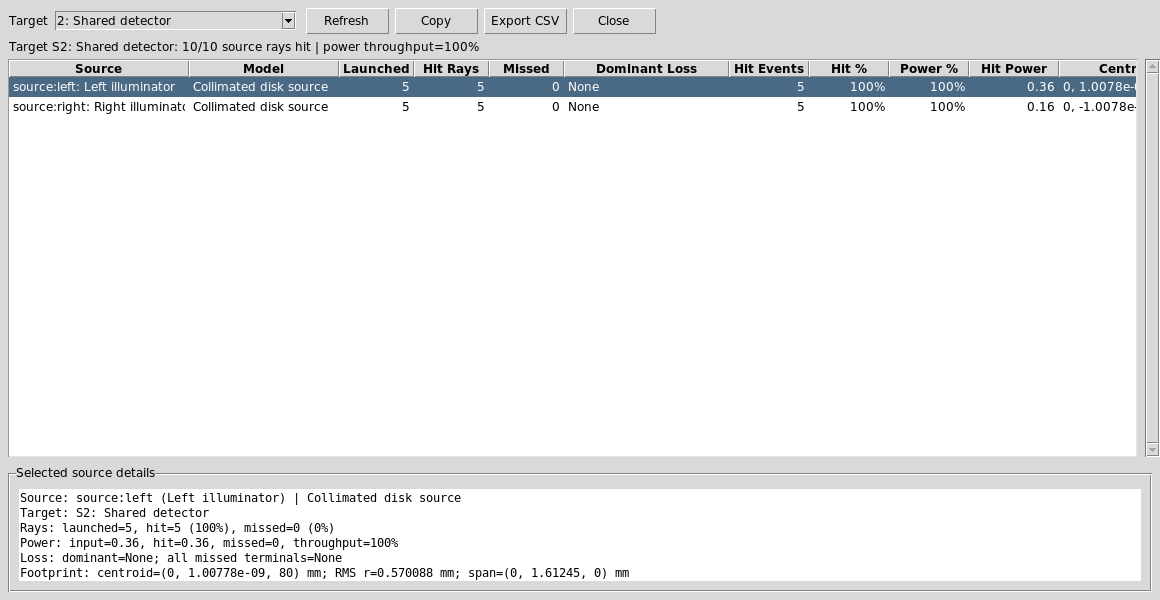
The report groups hits by SOURCE_ID. This is the key diagnostic for
multi-source layouts because it shows whether each source reaches the target
and how much power each source contributes.
Run Detector Analyses
Set:
Analysis path = All paths
Analysis surface = 2: Shared detector
Detector bins = 64
Click DetMap and Update.
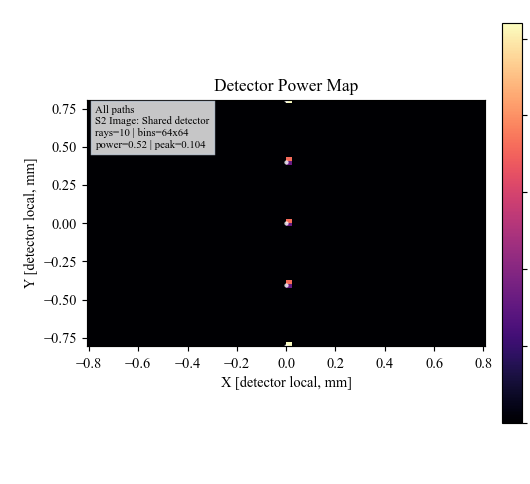
DetMap sums detector power from both sources.
Click Illum and Update.
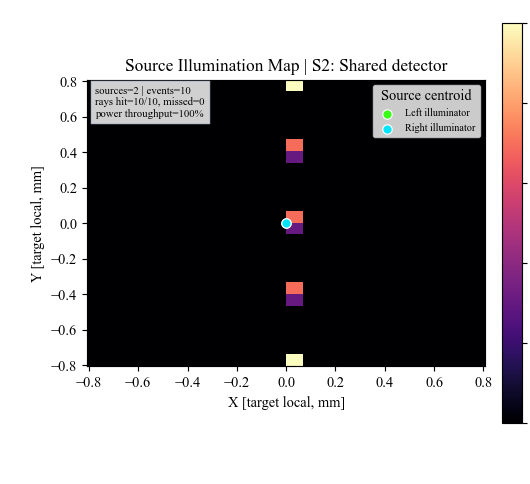
Illum plots the same target-hit records and overlays per-source
centroids so source balance is visible.
Run The Python Example
The same layout has a scriptable example:
python KrakenOS/Examples/Examp_Multi_Source_Illumination.py
The script prints both source records and then lists each traced ray with its
SOURCE_ID, surface sequence, detector-hit state, and source weight.
What This Proves
This case study exercises the explicit multi-source scene contract:
multiple physical sources are stored in
SETTINGS["scene_sources"];source rows are visible table scene rows, not optical
surfrows;each source keeps its own origin, direction, power, radius, and random seed;
traced rays preserve
SOURCE_IDmetadata;source reports and illumination maps group results by physical source;
detector analysis can still show the combined target power.
Common Mistakes
I expected source rows to be numbered like optical surfaces.Source rows are scene rows. They appear as
Src1andSrc2and do not change the KrakenOS surface indices.I changed the Source panel and expected both source rows to change.Explicit scene-source layouts are edited through Scene Source Manager or the source-row context menu. The Source panel is only the fallback single-source authoring path.
The detector map does not show which source made which spot.Use
Source Illumination ReportorIllumfor per-source grouping.DetMapis the combined detector power map.