7.32 Example — Source Distribution Function
PDF section 7.32. Source script: KrakenOS/Examples/Examp_Source_Distribution_Function.py.
Final example of the appendix: defines a custom source-distribution function that produces ray origins and directions according to a user-specified spatial/angular probability distribution. Useful for modelling extended sources, LED emitters or speckle distributions.
The script ends with several 3D viewer panels showing the source samples, the rays as they leave the source, and the resulting irradiance on the detector.
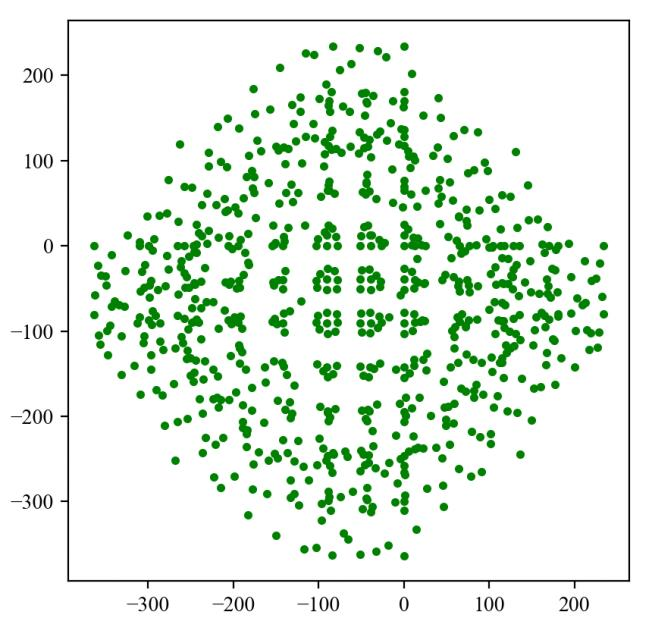
Figure 39a.
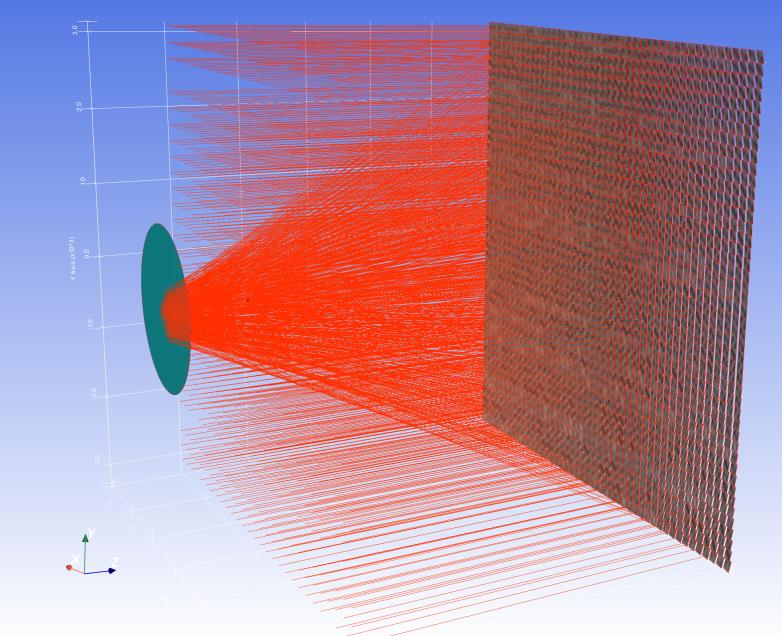
Figure 39b.
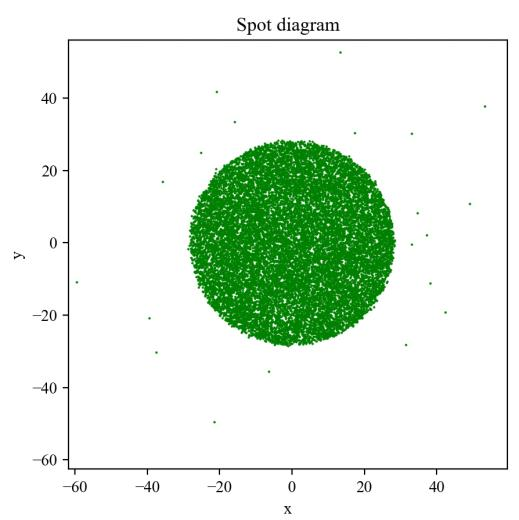
Figure 39c.
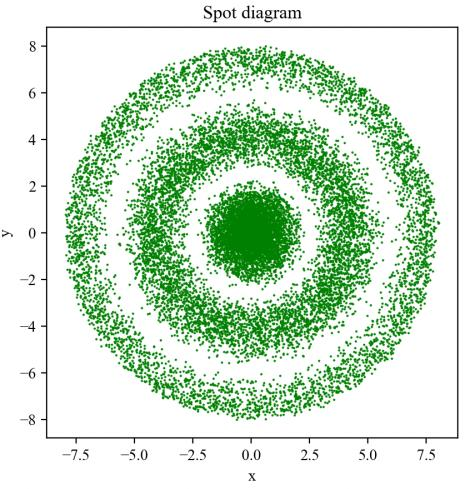
Figure 39d.
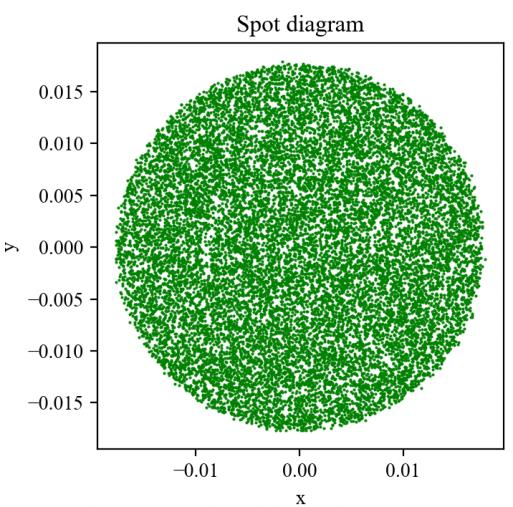
Figure 39e.
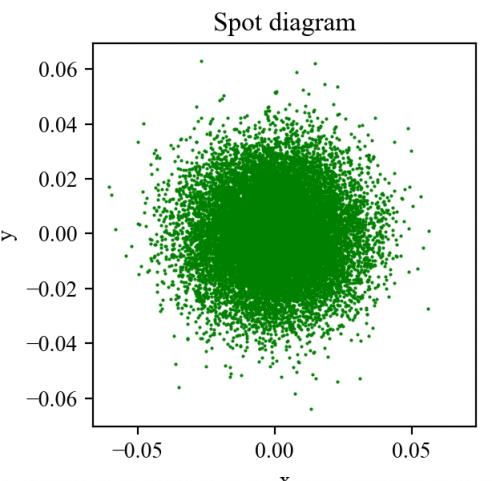
Figure 39f.
import matplotlib.pyplot as plt
import numpy as np
import pyvista as pv
import scipy
from importlib import metadata
required = {'KrakenOS'}
installed = {dist.metadata["Name"] for dist in metadata.distributions() if dist.metadata.get("Name")}
missing = {pkg for pkg in required if pkg not in installed}

if missing:
    print("No instalado")
    import sys
    sys.path.append("../..")


import KrakenOS as Kos

P_Obj = Kos.surf()

P_Obj.Thickness = 5000.0
P_Obj.Glass = "AIR"
P_Obj.Diameter = 6.796727741707513E+002 * 2.0
P_Obj.Drawing = 0

######################################################################################


objeto = Kos.surf()
objeto.Rc = -12000
objeto.k = -1
objeto.Diameter = 2500
objeto.Thickness = -6000
objeto.Glass = "MIRROR"

P_Ima = Kos.surf()
P_Ima.Rc = 0
P_Ima.Thickness = -1.0
P_Ima.Glass = "AIR"
P_Ima.Diameter = 6000.0
P_Ima.Drawing = 1
P_Ima.Name = "Plano imagen"

A = [P_Obj, objeto, P_Ima]

configur = Kos.Setup()
Telescope = Kos.system(A, configur)
Rays = Kos.raykeeper(Telescope)

W = 0.633
Sun = Kos.SourceRnd()

examp = 4
if examp == 0:
    # Sun distribution
    def f(x):
        teta = x
        FI = np.zeros_like(teta)
        Arg2 = np.argwhere(teta > (4.65 / 1000.0))
        FI = np.cos(0.326 * teta) / np.cos(0.308 * teta)

        Chi2 = .03
        k = 0.9 * np.log(13.5 * Chi2) * np.power(Chi2, -0.3)
        r = (2.2 * np.log(0.52 * Chi2) * np.power(Chi2, 0.43)) - 1.0
        FI[Arg2] = np.exp(k) * np.power(teta[Arg2] * 1.0e3, r)
        return FI


    Sun.field = 20 * np.rad2deg((4.65 / 1000.0))

if examp == 1:
    # Sinc cunction
    def f(x):
        Wh = 0.025
        r = (x * 90.0 / 0.025) * np.pi
        res = np.sin(r) / r
        return res


    Sun.field = 0.025 * 3

if examp == 2:
    # Flat
    def f(x):
        res = 1
        return res


    Sun.field = 1.2 / (2. * 3600.)

if examp == 3:
    # Parabolic
    def f(x):
        r = (x * 90.0 / 0.025)
        res = r ** 2
        return res


    Sun.field = 1.2 / (2. * 3600.)

if examp == 4:
    # Gaussian (Seeing)
    def f(x):
        x = np.rad2deg(x)
        seing = 1.2 / 3600.0
        sigma = seing / 2.3548
        mean = 0
        standard_deviation = sigma
        y = scipy.stats.norm(mean, standard_deviation)
        res = y.pdf(x)
        return res


    Sun.field = 4 * 1.2 / (2.0 * 3600.0)

Sun.fun = f
Sun.dim = 3000
Sun.num = 10000
L, M, N, X, Y, Z = Sun.rays()

Xr = np.zeros_like(L)
Yr = np.zeros_like(L)
Nr = np.zeros_like(L)

con = 0
con2 = 0
for i in range(0, Sun.num):
    if con2 == 10:
        print(100. * i / Sun.num)
        con2 = 0

    pSource_0 = [X[i], Y[i], Z[i]]
    dCos = [L[i], M[i], N[i]]
    Telescope.Trace(pSource_0, dCos, W)

    Xr[con] = Telescope.Hit_x[-1]
    Yr[con] = Telescope.Hit_y[-1]
    Nr[con] = Telescope.SURFACE[-1]
    con = con + 1
    con2 = con2 + 1
    # Rays.push()

args = np.argwhere(Nr == 2)
plt.plot(Xr[args], Yr[args], '.', c="g", markersize=1)

# axis labeling
plt.xlabel('x')
plt.ylabel('y')

# figure name
plt.title('Spot diagram')
plt.axis('square')
plt.show()

#             Rays.push()
# Kos.display3d(Telescope, Rays, 0)